Topic: Line chart always shows value on data point

Expected behavior
Line chart in the documentation just has points connected by lines, without any data value on the chart
Actual behavior
Point values are rendered on top of each point, even though I am not using chartjs-plugin-datalabels
Resources (screenshots, code snippets etc.)
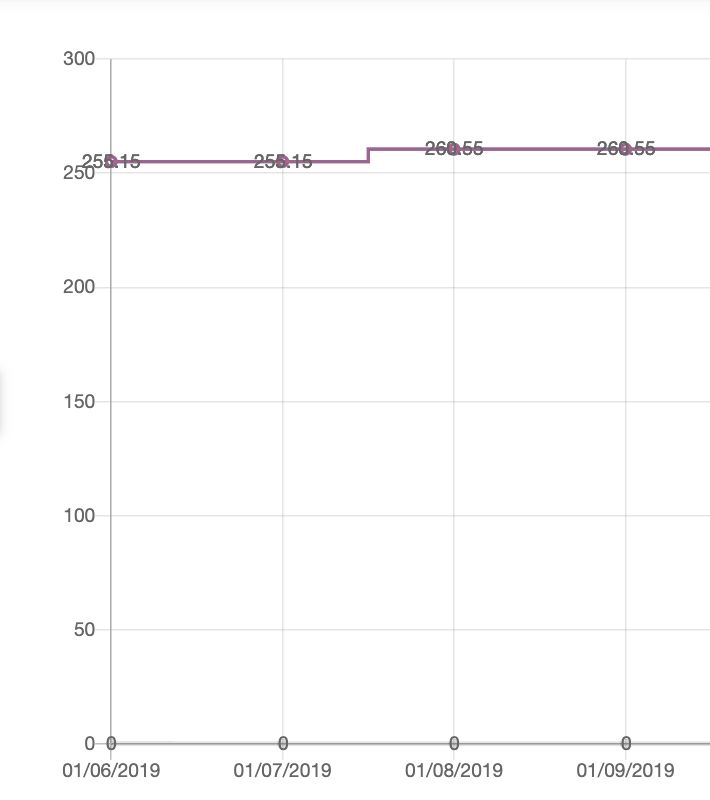
Chart options I am using:
public chartOptions: any = {
    responsive: true,
    maintainAspectRatio: false,
    plugins: {}
};
FREE CONSULTATION
Hire our experts to build a dedicated project. We'll analyze your business requirements, for free.
Status
Opened
Specification of the issue
- ForumUser: Free
- Premium support: No
- Technology: MDB Angular
- MDB Version: 8.8.0
- Device: Mac
- Browser: Chrome
- OS: MacOS
- Provided sample code: Yes
- Provided link: Yes
Konrad Stępień staff commented 5 years ago
Hi @rjy_rmtech,
Can you send me snippet with full code?
When I copy the example from the documentation with your options I do not have this problem.
rjy_rmtech free commented 5 years ago
I had to give up on this, copying the example from your documentation produces the same behaviour as the chart in the screenshot. Instead I had to Chart.js directly, for this reason and also because there is insufficient data provided in the click event.
Konrad Stępień staff commented 5 years ago
Either way, could I get more code to debug the problem?